Fast loading and well-designed applications are definitely the things that make customers happy with our services. For a customer on the way to convert to a buyer, every millisecond counts. Our high-speed networks that reached the outermost limits a little while ago may no longer be the showstoppers they once were. The root cause of slowdowns is unlikely to be people’s phones or computers—generally speaking, these have plenty of power. Unacceptable response times nearly always come down, in fact, to inadequate application design and implementation.
The problem is; we usually forget all our learnings in our next development assignment, and realize such issues too late. This post is meant as a kind of wake-up call to remind you of this kind of mistake. I’d like to guide you on how to build fantastic performance requirements that are an integral part of your application design, implementation and testing. The end result will be a wonderful user experience!
Getting the correct workload and usage figures is often no easy matter. If there’s already a version of this system in production, you can derive usage profiles by tracing transaction logs or by monitoring statistics from a web server, for example. If you develop a new application, you can use a formula such as Little’s Law.
Performance engineers know better than to trust the existing requirements per se. Instead, they use quantitative analysis for validating existing requirements, and develop the tests that are essential for valid new requirements.
Performance-requirement analysis is basically a two-step process. We start with a qualitative analysis to obtain the usage profiles and set performance targets; we then proceed with the quantitative analysis to get any missing figures or to validate the given targets.

Qualitative analysis
In the qualitative analysis, we focus on the volumes and throughput of:
online transactions
reports
batch processes
interfaces
user volumes
data volumes
Let your engineers know your expectations. Put them in the picture with the regular, peak and future-growth figures for each of these six elements.
The regular usage figures indicate the number of users and requests on an average business day. Depending on the type of business, workload figures can sometimes spike, reaching 10 times the regular volumes or even more. Usually we have a 1:3 distribution between regular and peak volumes. The marketing campaigns or the acquisition of new divisions that are lined up can also bring massive load volumes to our applications. That’s why it’s worth checking future-growth patterns with your customers, and preparing the necessary load-test scenarios.
Even when your workload model is in great shape, there could still be something missing. The developers and engineers involved in the testing stream will ask you for the oft-neglected details of response-time expectations. Having all the pages loading in less than 2 seconds is not quite good enough. A better approach is to break down the testing into online, batch, interfaces and user transactions, and specify response-time expectations in terms of percentiles.
Now you’ve prepared the expected response times as well as having created a nice workload model. The last missing pieces are the system-resource utilization metrics for all the components involved. You’ll need to declare your expected average CPU, memory, IO, network-utilization metrics and also specify the max figures. This approach will help your test engineers to validate the sizing of your infrastructure during a load and performance test.
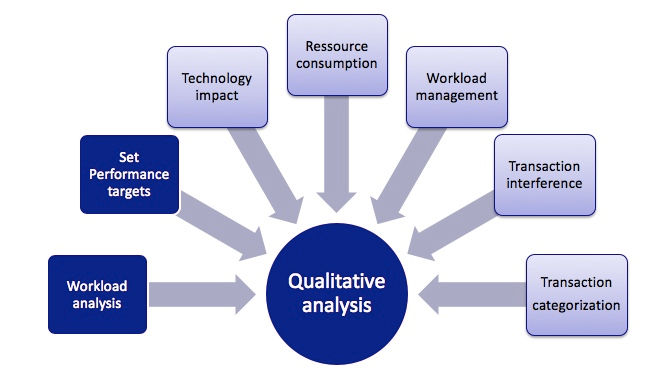
The chart below highlights all the steps of a qualitative analysis. Based on my experience, the elements in the dark-blue boxes are a must, whereas those in the light-blue boxes are optional.

Quantitative analysis
Apply quantitative analysis to check whether the given usage figures and performance targets are within realistic boundaries. It’s very important to adopt a methodical approach when we don’t receive high-quality requirements.
Architecture teams often evaluate various design decisions, and involve performance engineers to check the impact on the entire system landscape. Quantitative analysis also helps us understand the impact of system changes without the need for a single load test.
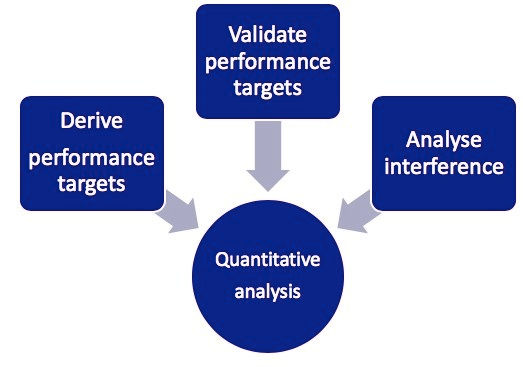
The chart below highlights all the steps of such an analysis.

Experience can help us to estimate rough figures, but sometimes we are lost nonetheless. Adopting a more professional approach using Little’s Law, for example, will give better results. We use the simplified version of J.D. Little’s 1961 theorem for closed systems.
The basic elements of Little’s Law:
N = user
X = transactions or requests per second
R = average response time per request or transaction
Z = average thinking time in which the user is viewing results or doing something else
Little’s Law: N = X (R+Z)
In our next post we’ll shed some light on real-world use cases as well as showing you how companies can become extremely proactive.
Keep doing the good work! Happy performance engineering!

Comments